Some recent results (June 2002)
The results presented here were obtained with a 2D axisymmetric adaptive
code, featuring:
- Berger and Oliger (B&O) adaptive mesh refinement (AMR)
- Truncation error estimation using a self-shadow hierarchy
- Equations derived using the 2+1+1 formalism, in cylindrical (rho,z)
coordinates
- Axis instabilities eliminated by applying appropriate regularity conditions
to all variables, and adding Kreiss-Oliger dissipation to evolution equations
- Partially-constrained evolution --- the elliptics are incorporated
into the B&O scheme by using a particular form of extrapolation in conjunction
with post-injection-solution of the elliptic equations (via multigrid)
- Current matter source is a minimally-coupled, massless scalar field
For more details see the preliminary draft of my thesis, available
here
Anti-symmetric scalar field critical collapse:
The initial data for this simulation is an imploding pulse of scalar field
energy, anti-symmetric about z=0. The anti-symmetry prevents any echoing
solution from developing at z=0 (at the the center of the implosion) at threshold.
Instead, two local self-similar solutions develop off-center. Here
is an animation of the scalar field phi in (rho,z) coordinates:
phi.mpg (3.9 MB) (smaller version:
phi_small.mpg (2.43MB)). The color and height of the surface in the animation
represents the magnitude of the scalar field.
The above solution was tuned to threshold to within 1 part in 10^16. The
anti-symmetry is not preserved exactly during evolution due to numerical
errors, and hence closer than around 10^-8 to threshold only the left-hand
(+z) echoing solution could be tuned to criticality. Around 3 full echoes
are observed in the +z solution, though the self-similar nature of the solution
prevents one from seeing this in the above animation in cylindrical coordinates.
The following image,
phi_ln(r).jpeg, is a snapshot of the last time of the simulation transformed
to a radial logarithmic coordinate r and angular coordinate theta, to better
demonstrate the self-similar nature of the solution. The transformation is
centered about the +z solution, and so the -z solution is severely distorted
in the image.
To illustrate the kind of grid-hierarchies produced during evolution, the
following series of images shows phi (in rho,z coordinates) as a 2:1 coarsened
wireframe mesh, at the initial time:
phi_wf_0.jpeg, and at the latest time, with each successive frame zooming
into the region of more refinement:
phi_tf_z1.jpeg,
phi_tf_z2.jpeg,
phi_tf_z3.jpeg,
phi_tf_z4.jpeg,
phi_tf_z5.jpeg,
phi_tf_z6.jpeg.
The base grid has a resolution of 65x129, and up to 24 levels of 2:1 refinement
were used during evolution.
Critical collapse of an imploding spherical pulse, with a 'strong'
l=2 angular dependence
From the series of scalar field simulations we have run to date, we have
found some evidence that there is an additional, 'mildly ' unstable non-spherical
(l=2) mode in scalar field critical collapse, that will cause a near critical
solution to eventually bifurcate into two, local centers (see the thesis
for more details). In the ongoing effort to try to obtain better evidence
for this behavior, we simulated an imploding pulse with a significant l=2
angular distribution. Here is an animation of the near critical solution
(to within 10^-16) in logarithmic coordinates:
phi.mpg (6.5MB) (smaller version
phi_small.mpg). Interestingly, most of the non-spherical part of the
scalar field gets 'shed' prior to the first echo, and the resulting self-similar
solution only has a small l=2 perturbation early on. This perturbation does
grow with time, though too slowly to see a bifurcation after the third echo.
The following sequence of wireframe images (again 2:1 coarsened and in rho,z
coordinates) show phi at the initial time:
phi_0.jpeg, and at a later time, where in the last frame the growing
asymmetry is evident:
phi_tf_z1.jpeg,
phi_tf_z2.jpeg,
phi_tf_z3.jpeg,
phi_tf_z4.jpeg,
phi_tf_z5.jpeg (solid-render of last frame:
phi_tf_z5_s.jpeg).
(The base grid has a resolution of 65x129, and up to 26 levels of 2:1 refinement
were used during this evolution.)
Note the possible 'bifurcation' of a near critical solution due to the growth
of the unstable mode is a different phenomena than the two centers seen in
the antisymmetric example above. In fact, the supposition would be that eventually
the +z solution in that simulation will also experience the instability and
bifurcate --- we see some evidence for this at late times within the simulation:
this figure,
phi_ln(r).jpeg, shows phi in logarithmic coordinates near the last echo,
but with the colormap chosen to highlight the growing asymmetry.
We are still in the process of trying to isolate the unstable mode, in particular
to see whether all simulations exhibit the same, unique mode, and to try
to estimate its growth rate.
Earlier Results
Feb. 2002
Near critical solution, from spherically-symmetric initial data:
Scalar field in ln(r,theta) coordinates:
phi_ssb_lnr.mpg (4.4MB)
Near critical solution, from initial data anti-symmetric about z=0:
Scalar field in (rho,z) coordinates:
static view:
phi_asym_gv.mpg (2.7MB)
zooming-in:
phi_asym_zoom.mpg (3.4MB)
May 2001
comparison between AMR and unigrid solutions
example 1:
Psi, AMR solution (64x128 base grid, 1 level of 4:1 refinement, 3 clusters
on level 2):
psi_amr_0.jpeg
difference in Psi between 64x128 unigrid and 256x512 unigrid solutions:
dpsi_uni_0.jpeg
difference in Psi between above AMR solution and 256x512 unigrid solution:
dpsi_amr_0.jpeg
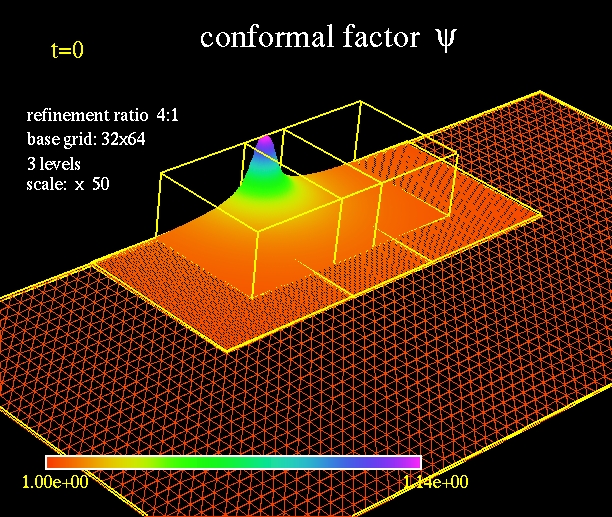
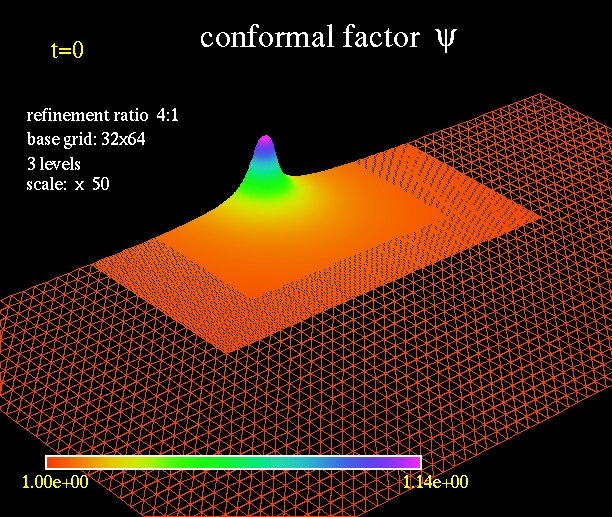
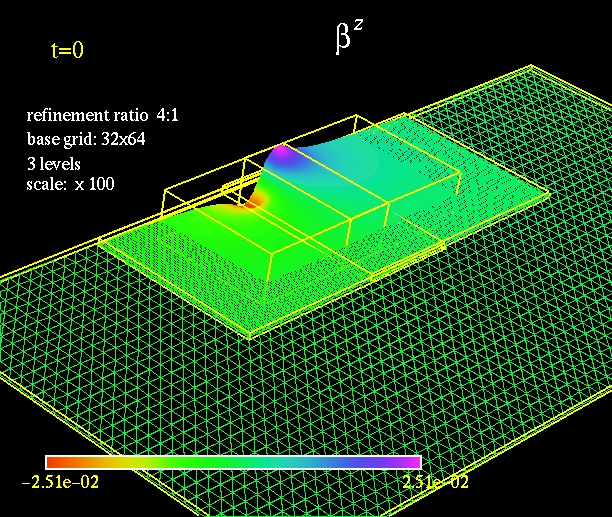
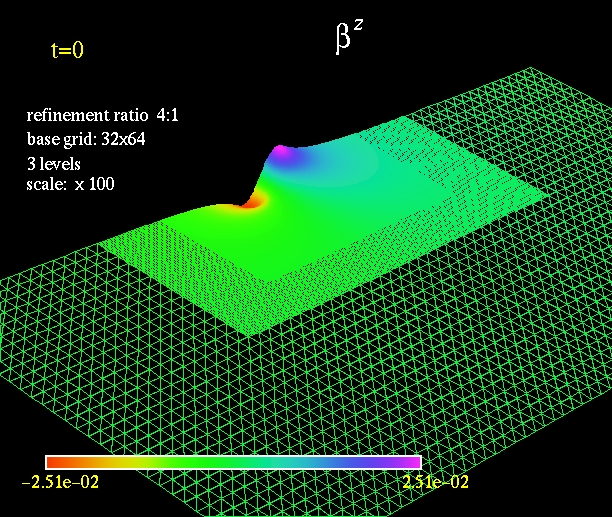
example 2:
AMR solution
Psi:
amr_psi_bbox_0.jpeg,
amr_psi_no_bbox_0.jpeg
Beta_z:
amr_bz_bbox_0.jpeg ,
amr_bz_no_bbox_0.jpeg
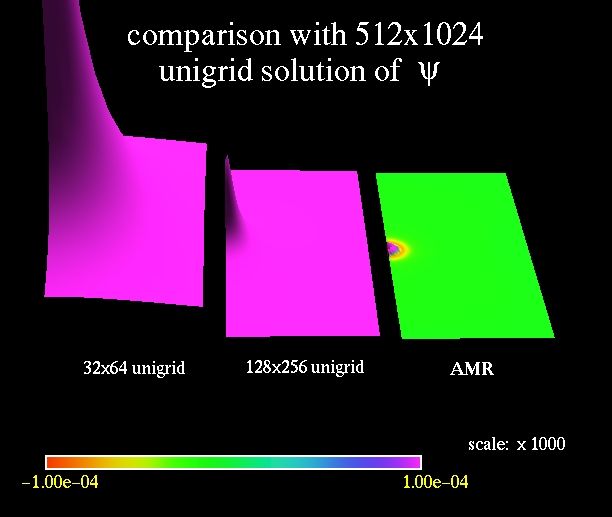
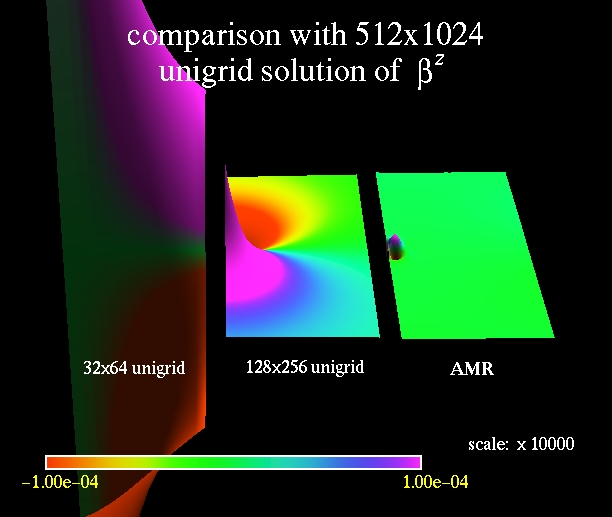
comparison with unigrid solutions (region of comparison is that of the
level 2 AMR grids):
Psi:
amr_psi_comp_0.jpeg
Beta_z:
amr_bz_comp_0.jpeg
(id files:
graxi_ad_id.control ,
graxi_ad_id.refctl )
Evolution
weak field run:
scalar field:
amr_phi.mpg
lapse:
amr_alpha.mpg
(id files:
graxi_ad_id.control ,
graxi_ad_id.refctl )