xvs: The Control Panel
The xvs control panel is a collection of tabbed folders
with the following tabs. Click on any of the links for information
about the corresponding sub-panel (folder).
NOTES:
- Many of the functions described below have keyboard
shortcuts---typically uppercase alphabetic characters---that
are given in parentheses following the panel/widget/function name.
For instance, "The Ops sub-panel (O)" means that SHIFT-O
will bring up the Ops sub-panel, "Auto (A)" means that SHIFT-A
will initiate auto-mode, etc.
- xvs operations and features (modes, applicators, plot styles etc.)
generally apply on a per-window basis, so that, for example, distinct
windows can be in distinct display modes at any given time. This behaviour can
be changed by depressing the All radio-button widget, found on the main
GUI, as well as the Ops, View and File sub-panels. Those
functions/widgets which will be then applied to all windows are
indicated with an asterix (*) below.
- In the following, Left, Right, Middle, and Any denote
clicks of the left, right, middle, and any mouse buttons respectively.
The Ops sub-panel (O)
Ops: Mode Menu
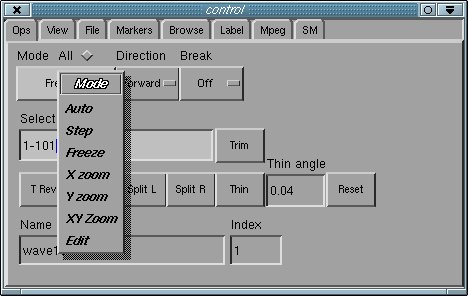
A particularly important widget on the Ops sub-panel is the
Mode pull down menu (as shown above), whose entries control
the major modes of xvs operation as follows:
Ops: Other Widgets
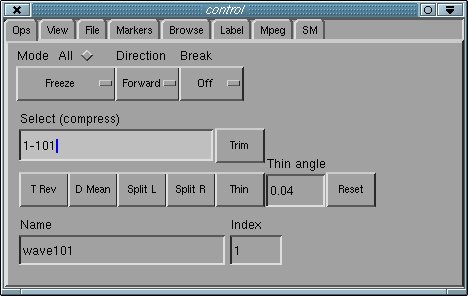
The other widgets on the Ops panel have functions as follows:
- All: Enables/disables the apply-to-all-windows feature.
- Select (compress)*: Using index vector notation, selects specified datasets
from the active window and deletes the rest. For example, 1-*/2
will select every second dataset (starting from the first) of the active
window, effectively halving the total amount of data that is stored.
- Trim* (T): Deletes the last dataset from the active window.
Particularly useful if the data originated from an .sdf file whose
last dataset is incomplete/corrupted due to interrupted/abnormal program
execution.
- T Rev*: Reverses the storage and display order of the active window's
datasets.
- D Mean*: Replaces the data in the active window with its deviation
about its mean, on a per timestep basis. Particularly useful for datasets
with small intrinsic variation compared to the size of the data.
- Split L: Prompts the user to enter cut x-coordinate
xc
via Any click.
After mouse click, creates new window containing duplicate of all data in the active window
with x < xc
- Split R: Prompts the user to enter cut x-coordinate
xc
via Any click.
After mouse click creates new window containing duplicate of all data in the active window
with x > xc
- Thin*: "Thins" data in active window so that line segments joining
final data points deviate from those joining the initial data points by no more
than approximately the angular displacement defined by the thin angle.
- Thin angle: Controls thinning operation defined above; smaller thinning
angles produces less thinning.
- Reset: Resets thinning angle to startup value.
- Name (R*): Window name: the active window may re re-named by typing in this
widget.
- Index*: Current display index. The dataset currently being viewed may
be changed by typing in this widget.
The View sub-panel (V)
A view of a dataset is defined as the 2-dimensional bounding box
(xmin,xmax,ymin,ymax)
giving the coordinate ranges of the currently viewed area. Normally, xvs
automatically re-scales the view to coincide with the extremal x and y values
of all datasets in a window (so called floating domain
mode). Many of the widgets in the view sub-panel allow this default
behaviour to be modified.
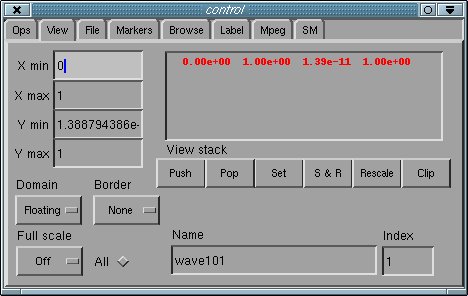
Functionality of the widgets in this panel is as follows:
- X min*: Sets the xmin value of the current view.
- X max*: Sets the xmax value of the current view.
- Y min*: Sets the ymin value of the current view.
Implicitly enables fixed domain mode.
- Y max*: Sets the ymax value of the current view.
Implicitly enables fixed domain mode.
- Domain*: Sets the domain mode to either fixed or
floating. When in floating mode, the view is autoscaled to
accomodate the extremal x and y values of all incoming data. In fixed
mode, incoming data lying outside of the current view is clipped (discarded).
- Full scale* (W): Enables/disables full scale mode. When
enabled, the view is adjusted at each timestep to match the extremal y
values of the corresponding dataset. Particularly useful when animating/stepping
data with a very large dynamic range. Note that the short-cut key, W,
is a toggle.
- Border*: Auto x bordering enlarges the x range of the view
by a fixed fractional amount. Auto xy bordering does the same for
both the x and y ranges of the view.
- All: Enables/disables the apply-to-all-windows feature.
- View stack A display widget that shows the current contents of the
view stack as well as the current view. The current view is
highlighted in red, entries in the view stack appear
after the current view, in top-down order.
- Push: Push the current view onto the view stack.
- Pop: Pop the top entry of the view stack.
- Set*: Set the current view to the top entry of the view stack.
- S & R (Set & Rescale)*: Set the current view to the top entry of the
view stack, then readjusts (ymin,ymax) to coincide
with the extremal y values taken over all data (all timesteps) within the x-range
of the view.
- Rescale*: Recomputes the global bounding box of the data in the
active window and sets the current view to the result.
- Clip* (P): Deletes all data in the active window that lies outside of
the current view.
- Name (R*): Window name: the active window may re re-named by typing in this
widget.
- Index*: Current display index. The dataset currently being viewed may
be changed by typing in this widget.
The File sub-panel (F2)
The file sub-panel is used to load data from .sdf files into the server,
as well as to save data from the server to .sdf files.
Note that .sdf file
loading can also be accomplished via the sdftoxvs command, and that
data from the server can be saved as files using the xvs save ... or
xvs saveall commands.
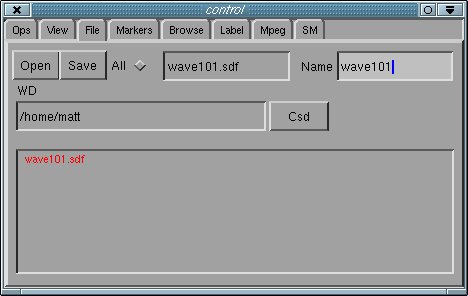
The File panel widgets operate as follows:
- Open: If no entries in the File Viewer have been selected
(see below), this button will pop up a file browser with a filter that selects
files with an .sdf extension. The file that is chosen via the browser
is then loaded into xvs. Otherwise, the button operates as described
in the File Viewer section.
- Save*: Saves the data in the active window to an .sdf file
with the name given in the text widget to the right of the Save button,
and in the directory specified in the WD text-type-in widget. The user
will be prompted to confirm overwrite if the save will overwrite an existing
file.
- All: Enables/disables the apply-to-all-windows feature.
- WD*: Displays the working directory associated with the active window.
The working directory can be changed by typing a valid directory name in the
widget.
- Csd*: If the file $HOME/sd exists and contains the name of
a valid directory, set the active window's working directory to that name.
- Name (R*): Window name: the active window may re re-named by typing in this
widget.
- File Viewer
The display area at the bottom of the panel is a browser that displays all .sdf files
in the working directory that contain rank-1 data sets. Any file that will
be clobbered by a Save operation is highlighted in red.
Entries in the browser area can be selected/deselected via Any mouse
clicks---hold a mouse button down and sweep to select/deselect multiple
entries. Once selected, the corresponding files can be loaded into xvs
by clicking the Open button.
The Markers sub-panel (M)
The Markers panel provides widgets to control the manner in which
datasets are plotted.
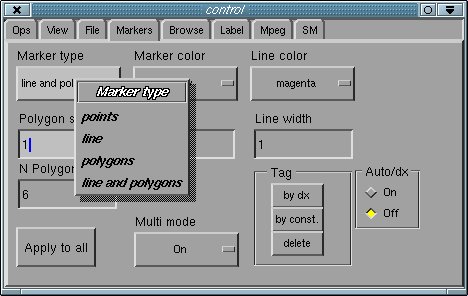
The Marker type menu, shown above, allows the selection of a number
of self-explanatory plotting styles.
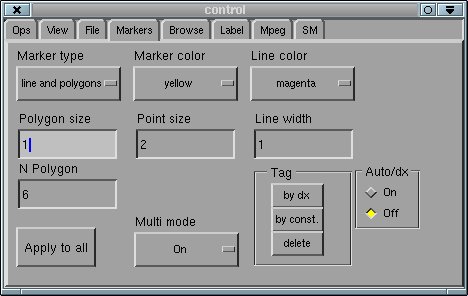
The other widgets in the panel function as follows:
- Marker color: This pulldown menu is used to set the marker
(points or polygons) color.
- Line color: This pulldown menu is used to set the line color.
- Polygon size: Sets the size of polygon markers to an integer multiple
of the base size.
- Point size: Sets the size of polygon markers to an integer multiple
of the base size.
- Line width: Sets the line width to an integer multiple of the base
- N polygon: Sets the number of sides for polygon markers.
- Apply to all: Apply current settings of all widgets in the panel to
all windows.
- Multi mode: This pulldown menu enables and disables multi mode.
When this mode is enabled, a change in sense of
dx = xj+1 - xj triggers a change in marker and/or
line color. This is particularly useful when multiple datasets with commensurate times
have been sent to xvs, such as will often occur in parameter space
surveys. In such cases, xvs simply appends the new data at a given
time to the old data at that same time, and then with multi mode enabled,
these logically distinct datasets will be displayed with distinct marker and/or
line colors.
- Tag by dx: Add a "color offset" to the marker and/or line color which
is a function of the local scale of discretization, dx. Used
to visualize results
from locally uniform adaptive mesh refinement calculations, whereby data values
will be color-coded according to dx.
- Tag by const.: Add a constant "color offset" to the marker and/or
line color. This function is rarely used.
- Tag delete: Delete any tag data associated with the current window's
data.
- Auto/dx on: Enable feature whereby incoming data is automatically
tagged by local scale of discretization.
- Auto/dx off: Disable auto/dx tagging.
Note that tagging and multi mode are generally incompatible.
The Browse sub-panel
The Browse panel allows the user to browse the numerical values of the
data stored in the active window.
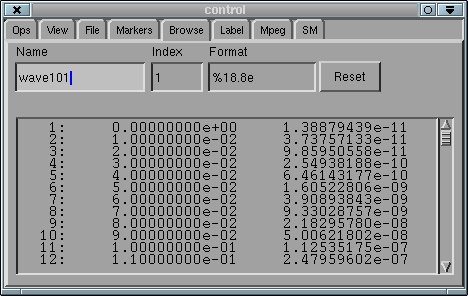
The widgets in this sub-panel function as follows:
- Name (R*): Window name: the active window may re re-named by typing in this
widget.
- Index: Current display index. The dataset currently being viewed may
be changed by typing in this widget.
- Format: This type-in widget defines the printf-style format
specification used in the browsing output window. The format may be changed
by typing a valid format code for a double in the widget.
- Reset: This button resets the display format to the xvsstart-up value.
The Label sub-panel
The label panel controls the display and appearance of the various
annotations which appear in xvs data windows. Note that annotation adjustments
apply to all windows, i.e. there is no per-window control of the
labeling.
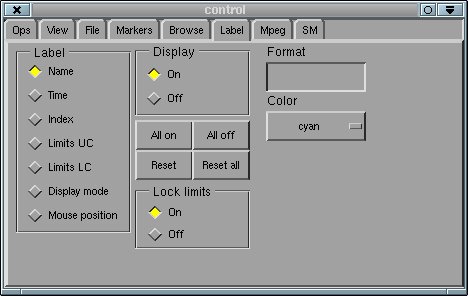
The Label widgets function as follows:
- Label: This radio button widget is used to select which annotation
is to be edited with the other widgets. Available annotations are as follows:
- Name: Window name.
- Time: Dataset time.
- Index: Dataset index and maximal index (number of datasets in window).
- Limits UC: Upper right corner limits: (xmin,ymin)
- Limits YC: Lower left corner limits: (xmax,ymax)
- Display mode: Current mode (Freeze, Auto,
Step, etc.); shown in lower right corner.
- Mouse position: Coordinates of mouse and coordinates of data point
nearest to the mouse mouse (displayed when the Middle mouse button is held
down in the active window.)
- Display: This radio button controls the visibility (on/off)
of the selected annotation.
- Format: This text type-in defines the printf-style
format code used to format the selected annotation.
- Color: This pull-down menu sets the color of the selected annotation.
- All on: This button makes all annotations visible.
- All off: This button makes all annotations invisible.
- Reset: This button resets widget settings for the selected
annotation to their start-up values.
- Reset all: This button resets widget settings of all annotations
to their startup values.
- Lock limits: When enabled, changes made to either one of Limits UC
or Limits LC are automatically applied to the other.
The Mpeg sub-panel
The MPEG panel allows the user to easily create an MPEG movie
file from the data stored in the active window.
The Berkeley MPEG tools, including executables mpeg_encode and
mpeg_play
are required for MPEG generation and playback. These tools may be
downloaded via
THIS PAGE.
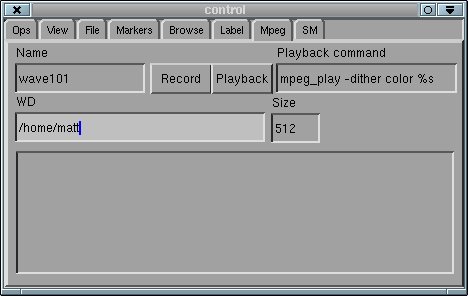
The Mpeg widgets operate as follows:
- Name (R*): Window name: the active window may re re-named by typing in this
widget.
- Record: Pushing this button will cause the generation of an MPEG
movie from the active window---the movie will be saved as a file with
an .mpeg extension in the directory defined by the WD
type-in. The GUI may resize slightly prior to the recording
operation due to restriction on the pixel widths of images which are to be
MPEG-encoded. The user will be prompted to confirm overwrite if the generated
MPEG file will clobber an existing file. Depending on the number of frames
(timesteps) being recorded, and the complexity of each frame, the generation of
the MPEG movie may take a significant amount of time (minutes), and xvs
will echo progress messages to standard output as the recording proceeds.
- Playback: Playback the most recently generated MPEG movie using
the command displayed in the Playback command text widget.
- WD: This text type-in defines the working directory for MPEG
generation and storage. The WD may be set by typing in a valid
directory name in the widget.
- Size: Displays the width and height, in pixels, of the images that
will make up the MPEG movie (xvs display windows always have a unit
aspect ratio).
The display area at the bottom of the panel displays all files
with an .mpeg extension
in the working directory. Any file that will be
clobbered by a Record operation is highlighted in red.
The SM sub-panel
The SM panel provides the user with an interface to the SuperMongo
(sm plotting package, and thus one way of producing publication-quality
plots (including hard-copy) of data stored in the server.
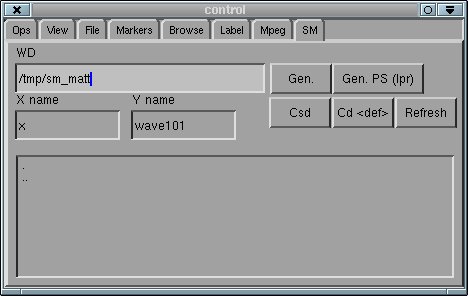
The widgets in this sub-panel function as follows:
- WD: This text type-in defines the working directory for sm
interaction. The WD may be set by typing in a valid
directory name in the widget.
- Gen.: Pressing this button causes the data defined at the
current display time in the active window to be dumped to a file with a
.dat extension in the working directory. A template sm script
is then generated and saved in a file named sm_NAME---where NAME is
replaced with the active window name (only alphanumeric characters and
underscores survive), also in that directory. xvs then spawns two
shell windows, one runs an sm session, into which sm_NAME
has been read, and the other invokes the text editor defined by the
EDITOR environment variable on sm_NAME. If the EDITOR
environment variable is not defined, vi is used.
- Gen. PS (lpr): As above, but have sm generate a Postscript
verision of the plot and send it to the system default lineprinter.
- Csd: If the file $HOME/sd exists and contains the name of
a valid directory, set the Sm working directory to that name.
- Cd : Set the Sm working directory to the xvs
default: /tmp/sm_$USER
- Refresh: Update the display area at the bottom of the panel,
which lists all files in the sm working directory.
- X name: This text-type in defines the string which will be
used to label the x-axis in the template sm script file.
- Y name: This text-type in defines the string which will be
used to label the y-axis in the template sm script file.
The display area at the bottom of the panel displays all files
in the sm working directory.
CAUTION!: Ensure that all of the shells (child processes)
which are created via
Gen. are closed (by, e.g., exiting the sm and editor
sessions), prior to exiting xvs. Otherwise, network resources
associated with xvs, including the main communications port,
will remain open, and xvs will not subsequently re-start until
the child processes have been terminated.